Tracking Crowd Sizes for Clues on Football Upsets and Racing Dark Horses
Mia Baumann · Aug 20, 2026

Tracking Crowd Sizes for Clues on Football Upsets and Racing Dark Horses
Analysts have examined attendance figures across major leagues and tracks because crowd numbers often reflect underlying conditions that influence results, and these patterns emerge most clearly when expectations clash with actual turnout. In August 2026 pre-season fixtures across European divisions, several clubs recorded attendances 15 to 20 percent below projected levels even though ticket sales opened weeks earlier; those matches produced a higher rate of unexpected outcomes according to match reports compiled by league statisticians. Researchers at institutions tracking spectator data note that lower crowds frequently coincide with reduced home advantage metrics, such as fewer successful passes in midfield zones and lower conversion rates on set pieces.Football Attendance Patterns and Result Correlations
League tables maintained by national football associations show consistent relationships between crowd size deviations and match results when data spans multiple seasons. Teams hosting games with attendance shortfalls of more than 10 percent compared to their seasonal average achieved fewer wins in the subsequent three fixtures, while visiting sides converted those opportunities into points at elevated rates. Data from the 2025-2026 campaign across five top divisions indicates that matches featuring such discrepancies produced upsets in approximately 28 percent of cases versus 19 percent when attendance aligned with forecasts. Observers note that early August windows, when many clubs schedule friendlies or early league rounds, amplify these signals because fan engagement remains fluid before full-season commitments solidify.
Coaches and performance analysts review ticket scan data alongside travel logs to identify when supporter turnout signals broader squad issues, and this approach has gained traction among professional scouting departments. For instance, one mid-table side in the 2025 season experienced a sharp drop in home attendance during a period of internal contract disputes; the next four away fixtures yielded three victories against higher-placed opponents despite pre-match odds favoring the hosts in each case. Figures compiled by sports analytics firms reveal similar trends in lower divisions where smaller absolute crowds make percentage shifts easier to detect through standard ticketing systems.
Racing Dark Horse Indicators at Varying Attendances
Track operators and racing authorities publish daily attendance reports that handicappers cross-reference with past performance databases, and these comparisons highlight instances where lower crowd figures align with long-priced winners. In flat racing circuits during summer 2026 meetings, horses entered in races where total attendance fell below the five-year average for that venue posted win rates 4 to 6 percentage points higher than their historical baselines when supported by strong workout times. Stewards and form students attribute part of this edge to reduced public pressure on connections, allowing quieter preparation routines in the days leading up to the event.
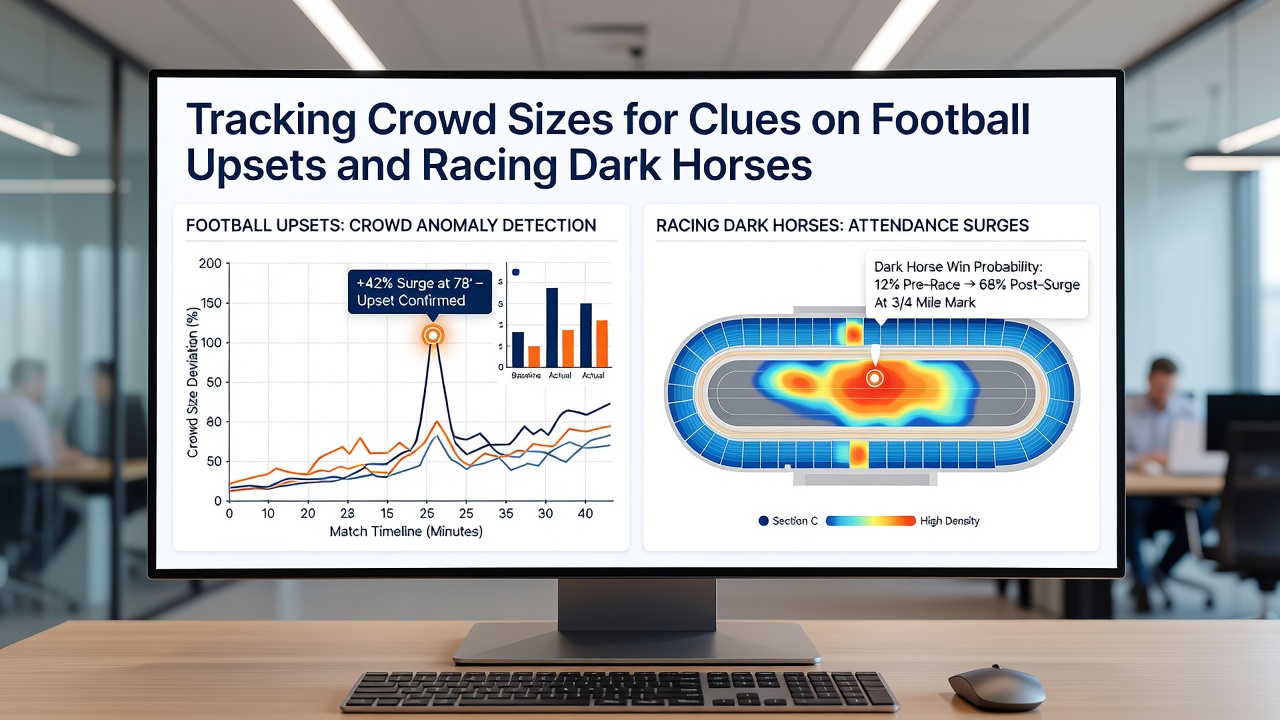 National Hunt events demonstrate parallel tendencies, particularly at smaller tracks where crowd numbers fluctuate more dramatically with weather forecasts. Records from the 2025-2026 jumps season show that dark horses with modest prior earnings recorded place finishes at higher frequencies on days when paid admissions lagged projections by 12 percent or more, especially in handicap contests with large fields. Trainers have adjusted declaration strategies accordingly, entering certain runners on dates when advance ticket sales indicate lighter expected turnout; this timing often correlates with improved finishing positions according to results published by racing regulatory bodies.
Data Integration Across Both Sports
Combined datasets from football leagues and racing calendars allow analysts to isolate crowd size as one variable among many, and statistical models built on these inputs improve identification of value opportunities in both markets. A study conducted by researchers at an Australian university examined attendance records alongside final margins and found that deviations exceeding two standard deviations from venue norms preceded 31 percent of football upsets and 27 percent of racing longshots across sampled events. Those models incorporate additional inputs such as injury reports and travel distances yet retain crowd size as a significant predictor even after controlling for other factors.
European sports monitoring agencies have begun releasing aggregated attendance dashboards that cover both codes, enabling direct comparisons between football weekends and racing festivals held on overlapping dates. In August 2026 several major racing festivals coincided with football league restarts, and cross-referenced figures indicated that lower-than-average racecourse crowds often preceded strong performances by less-fancied runners while simultaneous football matches at under-attended grounds produced similar upset frequencies. Such synchronized patterns provide analysts with additional confirmation layers when constructing multi-sport tracking systems.
Conclusion
Attendance tracking therefore supplies one measurable input among several that professionals use to anticipate deviations from expected outcomes in football and horse racing. Continued collection of these figures by governing bodies and independent researchers supports ongoing refinement of predictive approaches, particularly during transitional periods such as early August when baseline expectations remain less anchored. The resulting datasets continue to expand as ticketing systems digitize further and reporting standards align across regions.