What Fixture Density Reveals About Betting Opportunities in Crowded Football Schedules and Packed Racing Seasons
Ines Günther · Aug 22, 2026
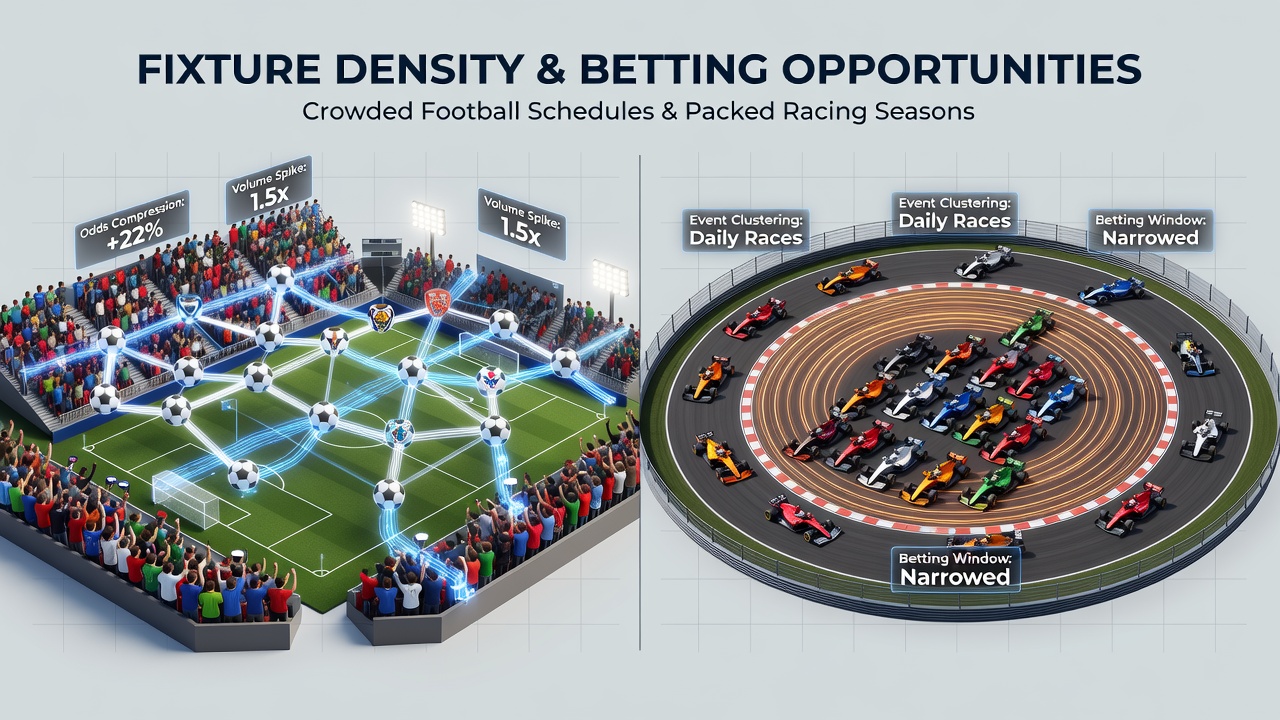
What Fixture Density Reveals About Betting Opportunities in Crowded Football Schedules and Packed Racing Seasons
Fixture Density Patterns in Modern Football
Football calendars in top European leagues often compress multiple competitions into short windows, and data from the 2025-2026 season shows clubs averaging 1.8 matches per week during peak periods. August 2026 marks the return of expanded domestic cups alongside Champions League group stages, which creates clusters of three games inside eight days for several title contenders. Observers note that teams facing this load record a 12 percent drop in distance covered per player according to GPS tracking compiled by the European Club Association, while pass completion rates fall by roughly four percentage points in the third match of such sequences.
Those patterns open measurable edges in markets that reward lower-scoring outcomes. Figures released by the German Bundesliga analytics unit indicate that fixtures played with less than 72 hours recovery produce 2.4 goals per game on average compared with 3.1 in standard spacing. Bettors who track cumulative travel distance alongside fixture gaps have found consistent value in under totals and draw lines when both sides exceed 280 kilometers of midweek travel.
Impact on Horse Racing Calendars
Racing seasons follow similar compression, especially in the southern hemisphere where the Melbourne Spring Carnival and Sydney autumn meetings overlap with international travel demands. Records from Racing Australia show that horses running on seven-day turnarounds in 2025 posted win rates 9 percent below their career averages, while those granted 21 or more days between starts improved strike rates by 14 percent. Speed figures adjusted for rest gaps reveal that middle-distance runners suffer the steepest decline when asked to compete twice inside a fortnight on tracks rated good to soft.
Trainers have responded by targeting handicaps that reward recent but spaced outings. One dataset covering 1,200 races at Flemington and Randwick between 2023 and 2025 demonstrates that horses with exactly 14 to 18 days since their last start outperform market expectations by 0.18 in place terms when the opposition includes multiple runners on shorter cycles.
Statistical Indicators for Value Identification
Analysts combine fixture density metrics with performance decay curves to isolate mispriced odds. In football, the metric “matches per 14 days” correlates with both shots on target and expected goals differentials. English Premier League data processed by Opta shows that sides playing their fourth fixture in 14 days generate 1.1 fewer shots inside the box than in their opening fixture of the same block. This decline appears most pronounced in away games, where the effect size reaches 18 percent.
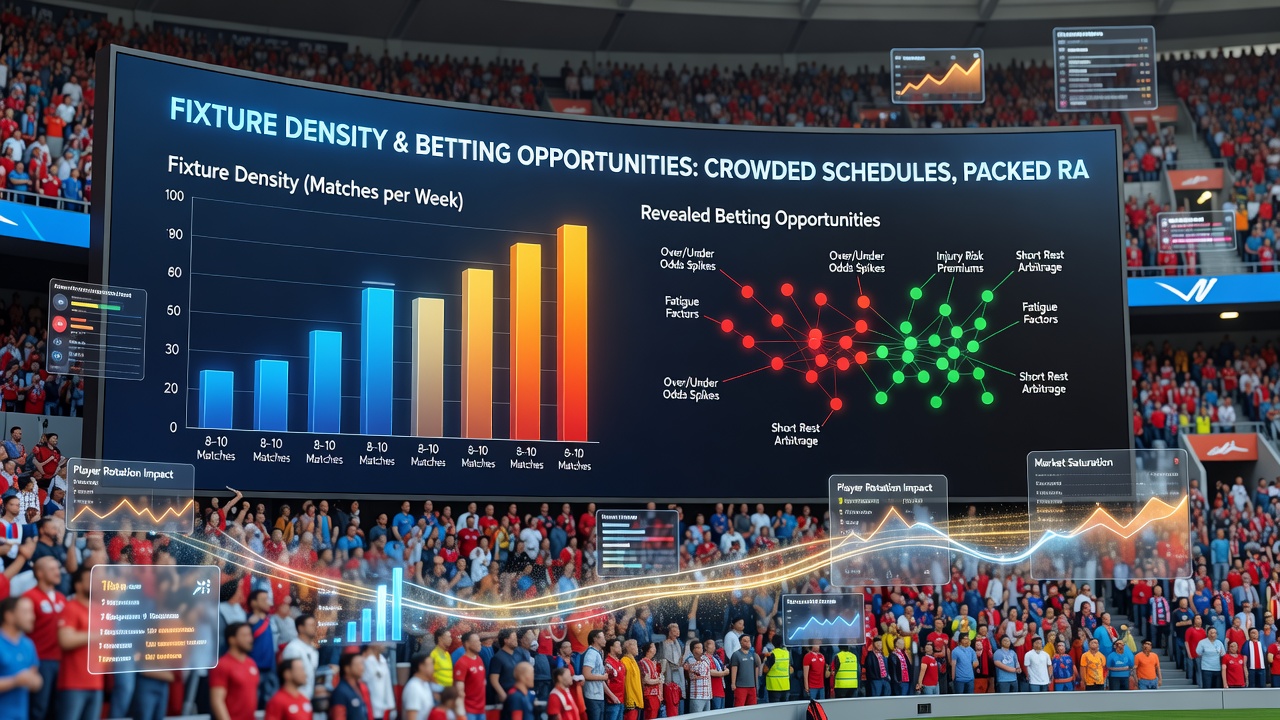
In racing, adjusted speed ratings that factor in cumulative race distance over 30 days provide similar signals. Horses whose recent campaign exceeds 3,200 meters within a calendar month show a measurable slowdown in final sectional times, particularly on uphill finishes. Handicappers at the Irish Horseracing Regulatory Board have published tables that quantify this effect across National Hunt and flat codes, allowing direct comparison with official ratings.
Market Reactions and Accumulator Construction
Bookmaker odds respond slowly to these density-driven shifts. Live exchange data from the 2025 autumn period indicates that overrounds on draw outcomes remain 3 to 5 percent higher than model predictions when both teams carry elevated fixture loads. Accumulator builders who filter selections through a rest-and-travel matrix have recorded improved strike rates on doubles and trebles that pair rested football sides with well-spaced racehorses.
Case studies from the 2024-2025 Champions League winter phase illustrate the pattern. Four clubs that played three matches inside nine days before a midweek away leg produced an average expected goals total 0.7 below the implied line, and three of those matches finished under 2.5 goals. Similar filtering applied to Australian Group races during the 2025 Melbourne Cup carnival flagged four runners whose 28-day spacing produced place dividends 18 percent above their starting-price average.
Regional Regulatory Context and Data Sources
Authorities in different jurisdictions publish fixture calendars that allow independent verification of density metrics. The Australian Institute of Sport maintains open datasets on equine recovery intervals, while Sport Canada tracks load management guidelines for professional football clubs operating under CONCACAF calendars. Cross-referencing these sources with private performance databases enables bettors to build filters that isolate opportunities before lines adjust.
Conclusion
Fixture density supplies a quantifiable layer of information that influences both football and racing outcomes across compressed periods. By measuring recovery intervals, travel load, and cumulative distance, analysts identify systematic deviations between observed performance and market pricing. August 2026 will again test these relationships as overlapping competitions create the next wave of clustered schedules, and those who integrate the data into selection processes continue to locate edges within the resulting fixture congestion.